
Your organisation tracks every software licence and every device. But can you really see what you own and what it costs you?
In many companies, asset data may exist but is not usable. Licences, hardware, responsibilities and contract data are maintained neatly, but when IT, Finance or management need concrete answers, the search begins: time-consuming, manual and often without a clear result.
The problem is therefore rarely a lack of data. The problem is a lack of transparency.
Can you answer these questions in less than five minutes?
- How high are our software costs per user?
- Which teams account for the largest part of our IT spend?
- For which tools are we possibly paying twice?
- What is our total spend with a specific vendor?
- Where are expensive licenses not used or barely used at all?
If these questions cannot be answered quickly and reliably, the issue is not a lack of data, but a visibility problem.
The real problem: data exists, insights are missing
Most companies use Asset Management systems to manage software licenses, hardware, and other IT resources. These systems serve their operational purpose: they document inventories, assignments, and technical details.
But that is exactly where the challenge begins.
Because operational transparency is not the same as strategic transparency.
An IT Asset Management system can usually answer whether an employee has access to a specific tool. However, it is often not designed to answer questions such as:
- Where are unnecessary license costs incurred?
- Which tools overlap functionally?
- Which organizational units are driving spend?
- Where do assignments and actual usage no longer align?
Answering such questions requires more than a data export. It requires context.
Why this is so difficult: The hierarchy of asset data
Asset data is rarely flat and directly analyzable. It usually follows a multi-level structure:
Workspace
  └─ Object Schema
      └─ Object Type
          └─ Object Instance
              └─ Attributes (cost, owner, renewal date, status)
This structure is sensible for administration and maintenance. However, it complicates access to the very information that is crucial for cost optimization and strategic decisions.
Finance needs totals by department.
IT requires insights by tool category.
Executives want to identify trends, anomalies, and areas of action.
A simple CSV export usually does not provide enough for this. While it contains names, IDs, and cost fields, it often lacks the relationships between objects, the organisational context, or the model logic behind the data.
To derive reliable insights from this, one usually has to:
- query multiple API endpoints,
- understand the underlying data model,
- correctly merge relationships,
- handle pagination, rate limits, and authentication,
- transform nested JSON structures into analysable formats.
This is exactly what costs time and is therefore often not implemented in day-to-day operations.
The solution approach: mirror data instead of replacing systems
Instead of replacing an existing asset management system, its data foundation can be specifically supplemented: by a structured mirroring of the existing information for analytical and decision-making purposes.
We have developed a lightweight tool specifically for this.
It connects to the existing asset API, traverses the complete hierarchy, and creates an analytical basis from it that is not only technically correct but also professionally understandable. The goal: to turn administrative data into genuine decision-making foundations.
What we have built
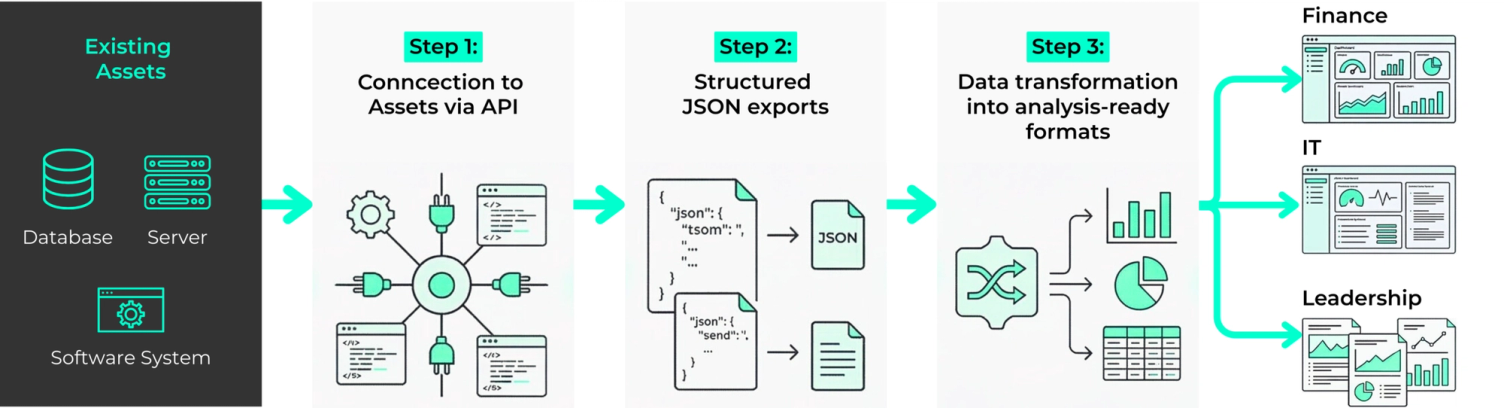
The solution is based on a lean Python utility that:
1. connects to the asset API and traverses the entire structure,
- Workspaces, Schemas, object types and attributes fully captured,
- Authentication securely handled via API tokens,
- Rate limits considered and failed requests retried,
2. exports the data as structured JSON snapshots,
- enables a complete data ingestion in around two minutes,
- is versionable and thus makes changes over time visible,
- allows offline analyses without permanently burdening the production API.
3. On this basis, the data is subsequently converted into analysable formats:
- CSV exports for Finance and Controlling,
- interactive HTML visualisations for IT and Management,
- filterable and sortable dashboards that can be used without additional infrastructure.
Importantly: The existing asset system remains in place. It is not replaced, but supplemented by a view that finally makes strategic questions answerable.
Why visualisation was crucial
Raw data is valuable. Visibility makes it effective.
In practice, it quickly became apparent that it was not complex analyses, but often already a single visualisation that triggered the decisive change. A diagram of licence costs per user, sorted by total expenditure was sufficient to steer discussions in a new direction.
Suddenly, questions that had remained open for months became answerable within minutes:
- Why are certain cost blocks unusually high?
- Which tools overlap functionally?
- Where are licenses assigned but not used effectively?
- Which structures in the system no longer reflect reality?
Data was therefore never the problem. It was only their processing that made the connections visible.
What the analysis showed at a mid-sized company
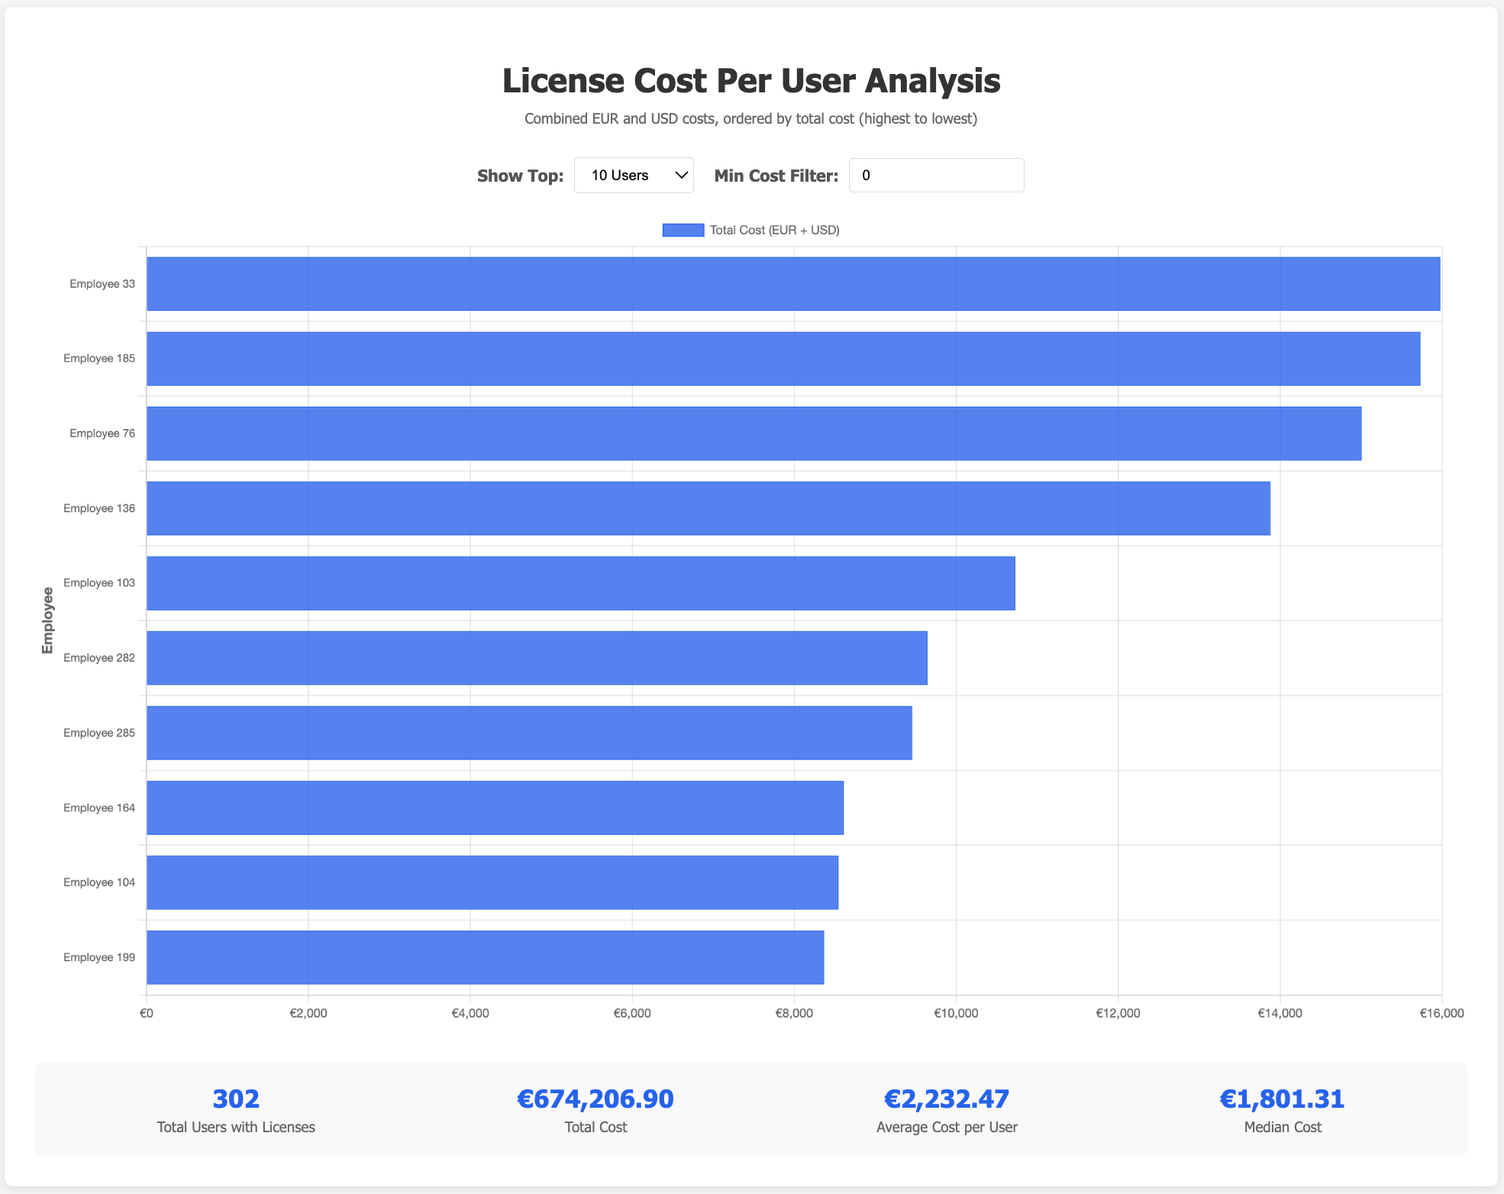
The evaluation for one of our clients revealed the potential hidden in this data:
- Several individual users caused annual license costs of over €10,000 across multiple tools.
- More than 80 employees had no licenses assigned – an indication of outdated accounts or roles that had changed without the asset model being adjusted.
- Less than 20 percent of users accounted for over 60 percent of the total license spend.
- Duplicate spending in EUR and USD became visible for identical tools, which had previously gone undetected due to the separate consideration of currencies.
- License assignments were still partly based on team structures from almost two years ago; despite organizational changes in the meantime.
The identified optimization potential was just under €50,000 per year.
Not through blanket cuts. But solely by making visible what was actually recorded in the system.
What this means for IT, Finance and Leadership
This kind of transparency creates more than just better reports.
It enables:
- more informed budget decisions,
- early identification of redundant tools,
- better preparation for renewals and contract negotiations,
- reliable allocation of costs to teams or functions,
- a common data foundation for IT, Finance and Management.
Especially in times of rising SaaS costs and growing tool landscapes, it is becoming increasingly important not only to manage assets, but to understand their economic impact.
Conclusion: You don't need a new system, but a clear view of your existing
Most companies already have the data they need for better decisions. What is rarely missing is technology. What is missing is transparency.
As long as IT asset data is only documented but not truly analysable, optimisation potential remains hidden. Only when structures, costs and relationships become visible does real value emerge.
The crucial question is therefore not whether your organisation has asset data.
The crucial question is: Can you derive the right decisions from it?
You want to find out what your asset data is not yet showing you today?
Let's check together which questions you currently cannot answer quickly and what optimisation potential is already contained in your existing data.